
Meteorological Analysis, Feb. 2-8, 1904
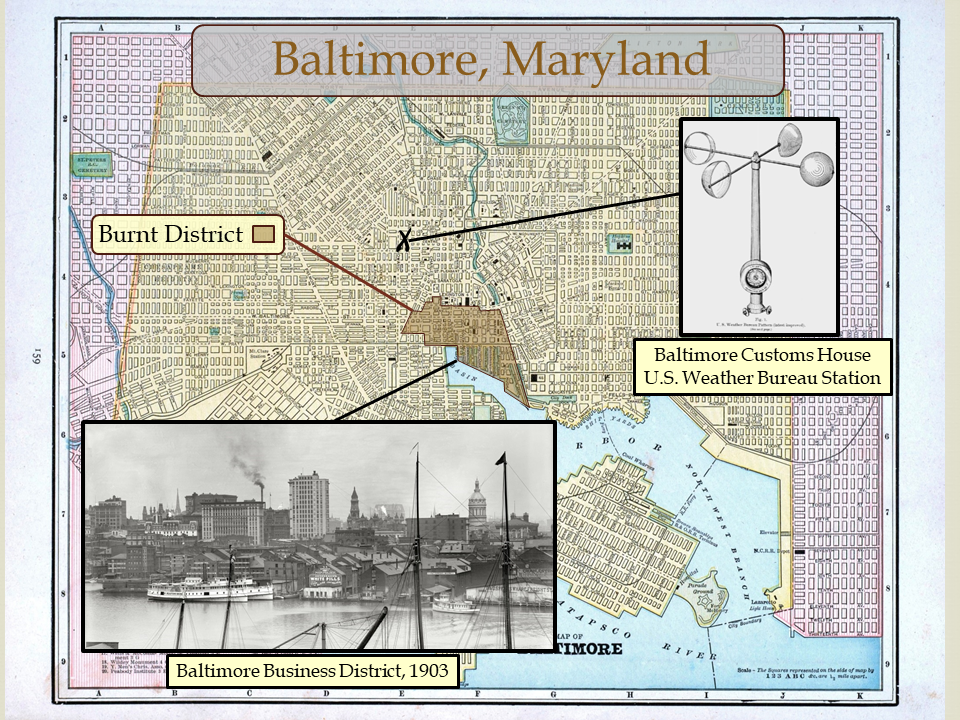
The historical map below (Fig. 6) reflects Baltimore in the early 1900s. The picture of Baltimore's downtown skyline (lower left) was taken in 1903 from Federal Hill, situated to the southwest across Baltimore's Inner Harbor. Over the course of 32 hours on Feb. 7-8, 1904, 140 acres marked by the shaded area in the photo were obliterated. This area subsequently became known as the "Burned District."
Helpful to this forensic analysis, there was a U.S. Weather Bureau Office (WBO) about 0.4 miles from the northwest edge of the fire zone at 532 W. Howard St. (X, Fig. 6). This weather station, on the property of John's Hopkins University, housed a full suite of early 1900s automated weather observing equipment. It carried the moniker "Baltimore Customs House." To acquire historical records for a weather reconstruction and analysis, my first task was to request historical data from the archive National Center for Environmental Information (NCEI) in Asheville, NC. My second task involved a visit to the National Oceanic and Atmospheric Administration (NOAA) Library in Silver Spring, MD to study the large form, U.S. Department of Agriculture Daily Weather Maps for early February, 1904 [2].
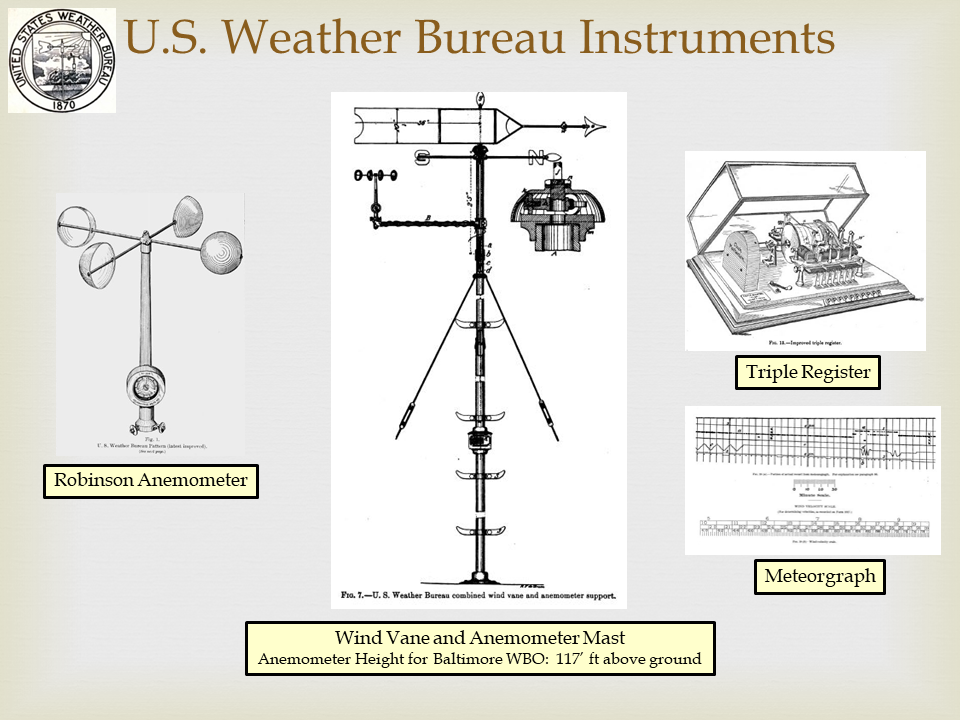
As a primary U.S. WBO, the Baltimore Customs House station was equipped with a Robinson Anemometer mounted on a mast with the weather vane (Fig. 7) sited on the station's roof. Standards published in the Anemometry Guide [3] of the U.S. Weather Bureau specify that the "position selected for exposure of the vane should be as unobstructed as possible by chimneys, domes, ventilators, towers, or adjacent buildings, or other objects that may interfere with the movement of the wind." For the Baltimore Customs House station in 1904, the anemometer height was 117 feet above ground (230 feet above sea level) representing an above roof-top wind.
A Triple Register (Fig. 7) recorded the wind velocity, wind direction, rain, and sunshine, with output recorded on a meteorgraph. Wind observations represented a 5- minute average (sustained wind) for winds 12 knots or greater. Winds less than 12 knots represented an average over an increasing time interval (greater than 5 minutes) as speed approached calm conditions. Observations were taken on a regular hourly schedule and logged on a Weather Bureau Form 1001B. Direction was reported to the eight primary compass points (N, NE, E, SW, etc.). Significant changes in weather conditions including wind speed and direction at any time of day were recorded in a daily Weather Bureau Journal. 12-hour peak wind speed and direction were also recorded along with other parameters twice daily (at approximately 8:00 a.m. and 8:00 p.m.) on Form 1001-Met'l, Original Monthly Record of Observations.
On Feb. 2-3, 1904 (5-6 days prior to the conflagration), a strong cold front ushered in arctic air, plunging temperatures in the mid-Atlantic region into the teens. A temperature of 16℉ was reported at the Baltimore Customs House at 8:00 a.m. on Feb. 3. On Feb. 4, high pressure moved into the region sparking a cold-air damming event 8 that featured a shallow wedge of frigid air spilling down the eastern edge of the Appalachian Mountains from Pennsylvania southward to North Carolina. The temperature at 8:00 a.m. on Feb. 4 in Baltimore was 17℉ and topped out in the mid-20s (℉) during the day as the barometric pressure continued to rise. On Feb. 5 the center of high pressure slid southeast toward the Atlantic coast and arctic air nosed its way into Georgia overnight Feb. 4 into the morning of Feb. 5. Throughout the day on Feb. 5, high pressure weakened as broad, warm southerly flow developed over the eastern U.S.
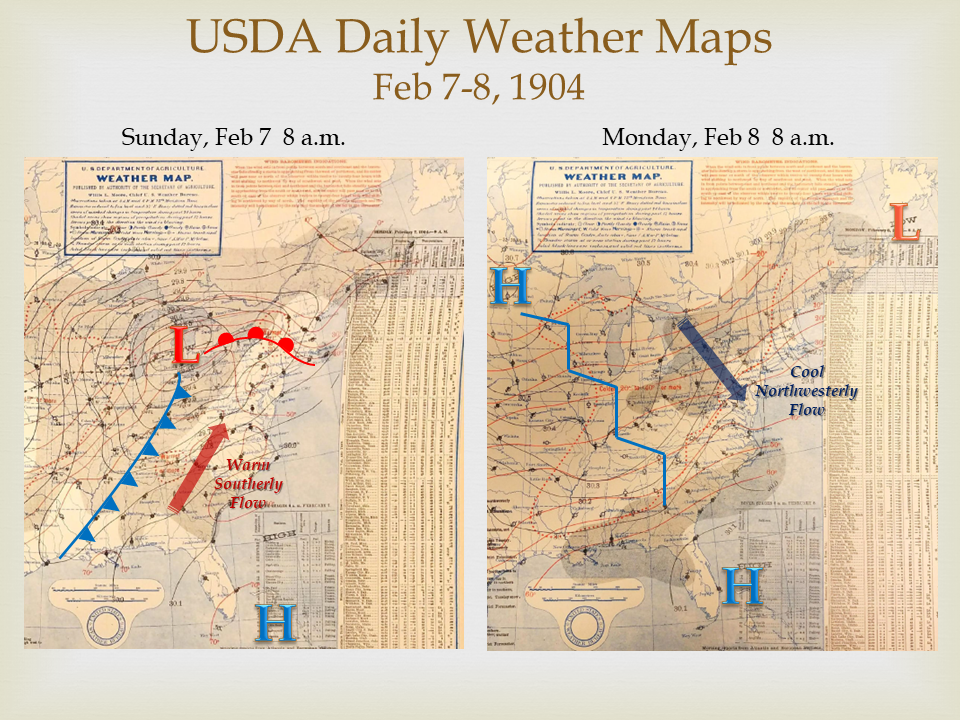
By 8:00 p.m. on Feb. 5, high pressure moved off the southeast coast putting the eastern seaboard of the U.S. into a warm southerly flow which scoured out all remnants of the arctic outbreak. At 8:00 p.m. on Feb. 6, the Baltimore WBO reported a temperature of 50℉. From the night of Feb.6 into the morning of Feb. 7, another low pressure system moved out of the west into Michigan's Upper Peninsula. As I have analyzed it on the map in Fig. 8, a trailing cold front snaked through the Mississippi Valley, poised to pounce on the U.S. east coast with yet another cold air outbreak. Between 7:00 and 8:00 p.m. on Sunday, Feb. 7, the front passed with hardly a trace of precipitation through the mid-Atlantic but brought with it brisk winds and falling temperatures as a high pressure ridge built in. This fast-moving frontal system followed by building high pressure were the large-scale (i.e., synoptic) features that created strong, gusty winds with shifting direction, driving the evolution of the Baltimore Fire.
The meteogram (Fig. 9) represents the local conditions in Baltimore on Feb. 7-8. The solid blue line is temperature (℉) while the green line is barometric pressure (inches). Wind barbs (knots) are depicted every two hours along the bottom of the chart starting with the first wind observation plotted at 10:00 a.m. on the far left. Gusts were estimated following Durst, 1960 [4]. To reconstruct these data, I primarily relied on two operational weather stations, the Baltimore Customs House and the U.S. Naval Observatory (USNO) in Washington, D.C. A data table with additional information is shown in the Appendix. I did not adjust the 3-hourly barometric readings from the USNO to expected station pressure for Baltimore. The purpose of analyzing the pressure data was to identify changes over time representing the pressure trend for Baltimore in this situation. I cross-compared these primary data with observations from additional stations in the region including the Washington, D.C. WBO and cooperative weather observation stations in Frederick, MD, Annapolis, MD and Prince Fredericktown, MD. NOAA's National Centers for Environmental Information (NCEI) provided the historical surface observational data from their official archive.
Overnight from Feb. 6 into Feb. 7, clear skies and calm winds provided conditions conducive for formation of a shallow, surface-based radiation inversion (inferred from the observational data) which cut off the surface layer of the atmosphere from the prevailing southerly flow aloft above the city and allowed the temperature to drop overnight. With a surface based radiation inversion, temperature increases with height from a minimum at the surface through a layer of about 300 feet on average. They typically form at night under clear, calm conditions. At 9:00 a.m. on Feb. 7 the temperature bottomed out at 39℉ and light fog was observed. Fog is consistent with the presence of a radiation inversion allowing the temperature to fall to the dew point under calm winds and the relative humidity to increase to near 100%. At 10:15 a.m., the radiation inversion broke as radiation from the sun heated the surface and lower levels of the atmosphere, allowing southerly flow aloft which had continued to increase overnight (but was cut off from the lower levels by the inversion) to mix down to the surface. This is evidenced by the sudden increase of winds observed at the Baltimore WBO at 10:15 a.m. from calm to 10 knots from the southwest at 117 feet above ground. Tragedies often result from an coincidence of unfortunate circumstances and that was true of the Baltimore fire. If the 10:45 a.m. fire alarm in the Hurst Building had sounded a couple of hours earlier while calm conditions prevailed under the atmospheric temperature inversion, this tragic conflagration might have been contained by first responders before it could spread.
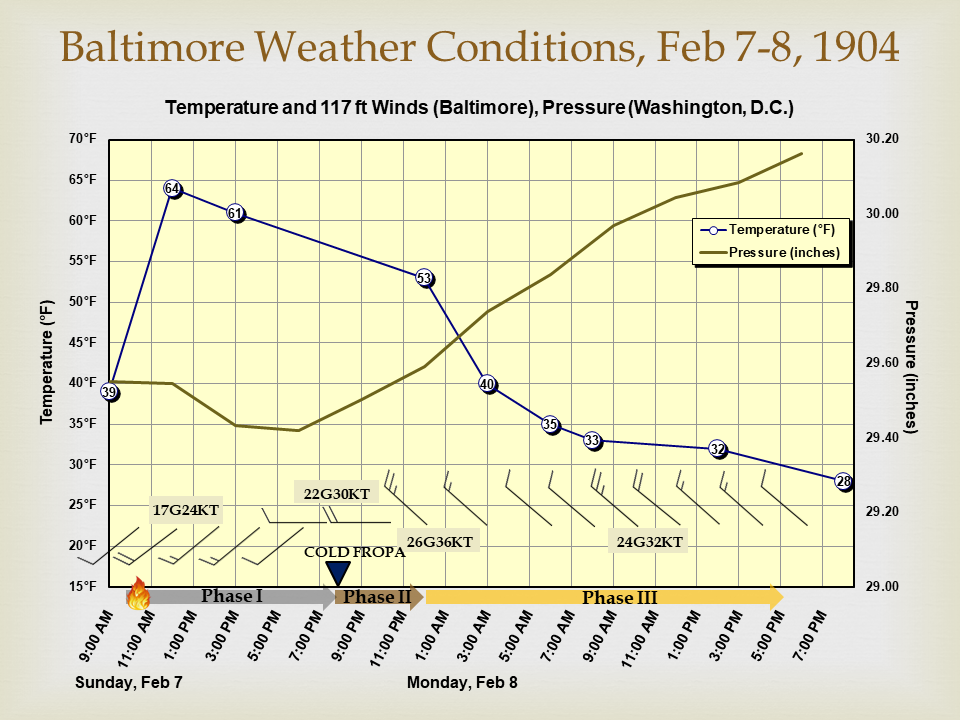
On Sunday, Feb. 7 from 10:00 a.m. to 7:30 p.m., winds were stiff out of the southwest with a peak of 17 knots gusting to 24 knots at noon. Prevailing conditions through the period were 12-15 knots gusting 18-21 knots. Using the power law to estimate winds closer to the surface at a standard, modern measurement height of 33 feet (or 10 meters), and assuming the frictional characteristics of an urban regime, I estimate that corresponding near surface winds were 10 knots gusting to 15 knots.
Based on the wind shift from southwesterly to westerly, the sudden change in the pressure tendency from decreasing to increasing, and the temperature trend, I determine with a high degree of certainty that the cold front analyzed to the west on the 8:00 a.m., Feb. 7 Daily Weather Map passed through Baltimore at about 7:30 p.m., Feb. 7. This event is marked by the blue triangle labeled "COLD FROPA" in the meteogram (Fig. 9). I estimate that around 2:00 p.m. on Monday, Feb. 8, the temperature fell below 32℉ consistent with the temperature readings at the USNO station in Washington, D.C. at 12:00 p.m. and 3:00 p.m., and the Baltimore WBO observation of 28℉ at 8:00 p.m. Not shown Fig. 9 is that the relative humidity also would have plummeted following frontal passage which created even more favorable incendiary conditions
As often occurs following passage of a cold front in this region, the winds shifted to northwesterly several hours after frontal passage as cold air started to pour into the city. Prevailing conditions from near midnight on Feb. 7 though the afternoon of the Feb. 8 were sustained northwest winds at 12-18 knots with estimated gusts 18-24 knots. Behind the front, winds shifted to westerly and stiffened with a peak of 22 knots gusting to 30 knots (35 miles per hour) at 11:00 p.m. The absolute maximum wind during the event was northwest at 26 knots gusting to an estimated 36 knots (41 miles per hour) on Feb. 7 at 11:40 p.m. At 10:00 a.m., Feb. 8 winds remained strong with an estimated 32 knot gust (37 miles per hour). Such post-frontal conditions are not unusual for the mid-Atlantic region in winter. However on Feb. 7-8, the stiff winds wreaked havoc on Baltimore.
[1] Sun Magazine (Title of article not available), Henry F., Published February 1, 1948.
[2] U.S. Daily Weather Maps available at: https://library.noaa.gov/Collections/Digital-Collections/US-Daily-Weather-Maps
[3] Anemometry (Circular D, Instrument Room), C. F. Marvin, Published 1893, U.S. Department of Agriculture, Weather Bureau, 40 pp. https://github.com/WeatherSleuth/1904-Baltimore-Fire/blob/master/Anemometry_Marvin_1893.pdf
[4] Wind Speeds Over Short Periods of Time, C.S. Durst, Meteorol. Mag., 89: 181-186, Published 1960.
[5] Report of the Chief Engineer, George W. Horton, Published 1904.
[6] The Baltimore Sun Almanac, Story of the Baltimore Fire, Published 1905.
[7] The Great Baltimore Fire, Peter B. Petersen, Published 2004 by the Maryland Historical Society, Baltimore (Md.), p. 192. ISBN 978-0938420903
[8] Wind Effects on Fires, W. M. Pitts, Prog. Energy Combust. Sci., Vol 17: 83-134, Published 1991.
[9] Firebrands and spotting in large-scale fires, Eunmo Koo and co-authors, International Journal of Wildland Fire, 19, 818-843, Published by CSIRO Publishing.
[10] Spot fire distance from burning trees-a predictive model, F. A. Albini, General Technical Rep. INT-56, Published 1979 by U.S. Forest Service
[11] The Great Conflagration: Chicago - its Past, Present and Future, J.W. Sheahan and G.P. Upton. Published 1872 by Union Publishing, Philadelphia, PA.
[12] The Great London Fire 1666, W.G. Bell. Published 1920 by John Lane Company, London.
[13] The Fireman's Record, J. Albert Cassedy, Vol II, Published 1911 by The Association, 336 pp. Available from UMBC Digital Collection: http://contentdm.ad.umbc.edu/cdm/compoundobject/collection/firemensrec/id/340
[14] Baltimore Weather Bureau Office Daily Journal from 7-8 February, 1904. Available from National Centers for Environmental Information (NCEI).
[15] History of the J.P. Freiz & Sons Co, A Thesis Prepared for the Phi Mu Honorary Engineering Fraternity, George R. Phipps, 1929, 15 pp. Available at https://github.com/WeatherSleuth/1904-Baltimore-Fire/blob/master/history_of_jp_friez_co_1929.pdf
[16] Mass Fires and Fire Behavior, C. M. Countryman, Rep. PSW-19, Published 1964 by the U.S. Forest Service
[17] Fire weather conditions and fire-atmosphere interactions observed during low intensity prescribed fires - RxCADRE 2012, C.B. Clements and co-authors, International Journal of Wildfire, 25, 90-101, Published 2016 by CSIRO Publishing.
[19] Billion-Dollar Weather and Climate Disasters, National Centers for Environmental Information as of 21 Dec 2018. Available at: https://www.ncdc.noaa.gov/billions/events/US/1980-2018
[20] Souvenir of The Baltimore Fire , February 7th, 8th, and 9th, 1904 As Seen Through a Camera, Hement, J. , Published 1904 by the A.B. Benesh Company available through Library of Congress, Digitized Internet Archive: https://archive.org/details/souvenirofbaltim00heme/page/n1
[21] Illustrated Catalogue of Meteorological Instruments and Apparatus (A Handbook of Meteorology in Respect to Standard Meteorological Instruments), Julien P. Friez, Published 1893 , 77 pp. (Smithsonian Library) https://github.com/WeatherSleuth/1904-Baltimore-Fire/blob/master/Friez_catalog_1893.pdf
Note: All images are in the public domain (pre-1923) unless otherwise noted.
Figure 6. Lower left: Baltimore Business District from Federal Hill, 1903. (http://www.shorpy.com/node/12633) - permission for use granted via personal communication, Dec 2018. Upper right (anemometer): Freiz Catalog [21] (https://github.com/WeatherSleuth/1904-Baltimore-Fire/blob/master/Friez_catalog_1893.pdf) Source of map: http://alabAMAMaps.ua.edu/historicalmaps/us_states/maryland/Baltimore.htm
Figure 7. Far left (anemometer): Freiz Catalog [21] (https://github.com/WeatherSleuth/1904-Baltimore-Fire/blob/master/Friez_catalog_1893.pdf) Middle and Right: [3] (https://github.com/WeatherSleuth/1904-Baltimore-Fire/blob/master/Anemometry_Marvin_1893.pdf)
Figure 8. USDA Daily Weather Maps [2]. Left: (https://github.com/WeatherSleuth/1904-Baltimore-Fire/blob/master/7%20Feb%201904%20Daily%20Wx%20Map.jpeg) Right: (https://github.com/WeatherSleuth/1904-Baltimore-Fire/blob/master/8%20Feb%201904%20Daily%20Wx%20Map.jpeg)
Figure 9. N/A